Analyzing and Classifying Cardiac Biosignals
The electrocardiogram (ECG) provides a noninvasive transthoracic interpretation of the electrical activity of the heart. Cardiovascular dysfunction often manifests itself in characteristic alterations of the ECG, in the heart rate variability and in the corresponding patterns of so-called beat-to-beat intervals (BBI), i.e. periods of time between consecutive heart beats (or QRS-complexes; see Fig. 1A). The ability to classify physiological and pathological BBI patterns is critically important for the development of new diagnostic tools. Successful classification of BBI time series, however, strongly depends on the availability of significant features. There exist a large number of so-called heart rate variability parameters that we have implemented for application and evaluation, including time and frequency domain parameters, or methods based on nonlinear or symbolic dynamics [1,2]. Time domain parameters are based on statistical methods derived from the RR-intervals as well as the differences between them. The mean heart rate (meanNN) is the simplest parameter, while the standard deviation for the whole time series (sdNN) is the most prominent HRV measure for estimating overall HRV. Frequency domain HRV parameters focus on periodic components in the heart rate time series. High frequency power reflects modulation of vagal activity by respiration, whereas low frequency power represents vagal and sympathetic activity via the baroreflex loop. The low-to-high frequency ratio is used as an index of sympathovagal balance. Symbolic dynamics provides a class of features by transforming the time series into a sequence of symbols from a finite alphabet, which is then characterized by entropies or related statistical concepts. In this context we introduced a new family of features based on ordinal pattern statistics that turned out to be very competitive with respect to conventional heart rate variability measures [2-4]. Ordinal patterns describe the relations within short segments of length $W$ of a given time series as illustrated in Fig. 1B. A unique index can be assigned to each ordinal pattern by interpreting the subsequence as a permutation that is characterized by a permutation index as shown in Fig. 1B for subsequences of length $W=3$. Ordinal patterns and permutation indices are easy to compute and robust against noise.
Each time series can be transformed into a sequence of permutation indices providing a sequence of symbols from a finite alphabet of size $W!$. The concept of ordinal pattern can be extended by considering not only consecutive samples but also subsequences with samples $x(n)$, $x(n+L)$, $x(n+2L)$, $\ldots$, $x(n+(W −1)L)$ that are separated in time by a lag of $L$ sampling times $TS$ which corresponds to a delay of $T = L·TS$ in (absolute) time units. The probabilities of occurrence of specific patterns with permutation index $I$ for a given delay $T$ and length $W$ are used as features for characterizing the underlying time series and will be denoted in the following by “$\text{perm}(T,W,I)$”.
As an example we distinguished 15 patients suffering from Congestive Heart Failure from a control group of 15 healthy subjects using beat-to-beat time series [2-4].
Figure 1
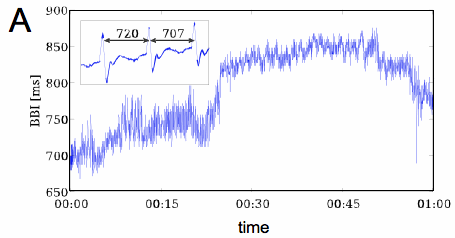
(A) Beat-to-beat interval (BBI) time series obtained from electrocardiogram (ECG; inset).
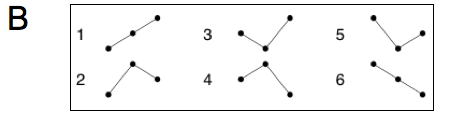
(B) Schematic of ordinal patterns of length W=3 and corresponding permutation indices plotted vs. time (horizontal axis).
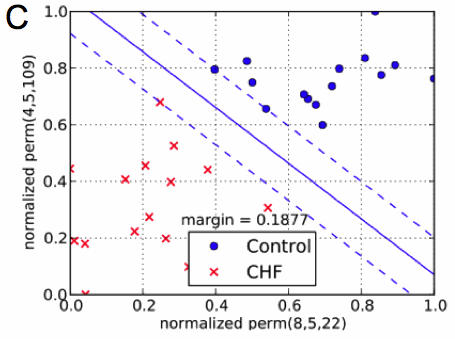
(C) Classification of beat-to-beat time series using ordinal pattern statistics spanning a two-dimensional feature space. The separating (solid) line was computed by means of a support vector machine (from [2]).
Figure 1C shows a plot where for each (filtered) beat-to-beat time series (i.e. for each test person) the values of $\text{perm}(3,4,3)$ are plotted vs. the probability $\text{perm}(4,4,3)$. Both probabilities of ordinal patterns are normalized with respect to the smallest and the largest value occurring in the full data set. Points representing patients suffering from CHF are marked as a (red) cross while data associated with persons from the control group are plotted as filled (blue) circles. As can be seen, both sets of points are clearly separated. To quantify the amount of separation, a linear support vector machine has been used to compute a separating line with a maximal margin [2].
Comparison of features based on ordinal pattern statistics with conventional heart rate variability parameters using p-values as well as Leave-One-Out Cross Validation errors shows that they provide valuable, non-redundant information about the underlying time series, increasing the discriminative power of signal classification methods [2].
The availability of different parameters (or “biomarkers’) efficiently describing a (ECG-) time series is an important prerequisite for employing multidimensional classification schemes to separate signal classes (see Fig. 1C).
References
- A. Schlemmer et al., Proc. Int. Biosignal Processing. Berlin, Germany, 2010: 094: 1-4.
- U. Parlitz, S. Berg, S. Luther, A. Schirdewan, J. Kurths, N. Wessel, Computers in Biology and Medicine (in press). http://dx.doi.org/10.1016/j.compbiomed.2011.03.017
- U. Parlitz at al., Proceedings of the 6th Conference of the European Study Group on Cardiovascular Oscillations (ESGCO 2010), April 12-14, 2010, Berlin, Germany, P030:1-4
- S. Berg et al., Proc. Int. Biosignal Processing. Berlin, Germany, 2010: 049: 1-4.